Cohort Analysis Based on First Meaningful Action in B2B SaaS
Starting cohorts at signup masks activation failures that look like product problems.

Cohort analysis is only as trustworthy as the event that starts it, and most B2B SaaS teams start it at the wrong event. Grouping customers by signup date feels like the obvious default, but it quietly destroys the thing cohort analysis is supposed to produce: a clean signal about whether product, onboarding, or pricing changes are working.
The math behind this failure is straightforward. Across 62 B2B SaaS companies, roughly two-thirds of new signups never experience the core value the product was built to deliver. These accounts don't churn in any dramatic sense. They just stop showing up, and because the cohort clock started at signup, they get counted as retained customers right up until the moment they vanish. Every curve built this way carries a population of accounts that were never real customers to begin with, and their silent departure gets mistaken for product or pricing failure when it's actually an activation failure that happened upstream.
Procedural completion makes this worse because it looks exactly like progress. A 90% completion rate just means people followed the flow, not that anyone found anything worth coming back for.
The deeper cost appears when a team watches only aggregate metrics. Aggregate MRR growth can mask degrading cohort retention entirely; a cohort matrix is the instrument that surfaces whether recent cohorts are retaining worse than older ones. But that only works if the cohorts are drawn from a starting point that means something. Started from signup, all three collapse into one indistinguishable flat line. A team staring at that line has no way to know whether the fix is a better onboarding flow, a tighter sales qualification process, or a different pricing tier, because the data doesn't separate the causes.
That collapse is why the activation event matters so much for prescriptive action.
What makes an action "first meaningful
Activation is the point at which a new user first experiences the product's intended benefit, rather than the moment they sign up, verify an email, or click through a product tour. The distinction matters because a cohort built on any of those earlier events inherits the same contamination problem described above: it counts people who were present but not served.
Finding the right starting event begins with the product's actual promise. Each of these candidates comes directly out of what the product claims to do for the customer, not out of what's easiest to instrument.
A candidate drawn from the product promise still has to be tested rather than declared an "aha moment" by intuition. The wider the gap, the stronger the candidate.
That gap is correlational evidence, not proof of causation. The distinction matters directly when a team decides whether to intervene by pushing more users toward the candidate action, since doing so only pays off if the action is genuinely load-bearing rather than a marker of motivation that was already there.
RevenueCat's framing sets out three tests a valid activation event has to pass: activated users retain meaningfully better than non-activated users, that relationship holds up across different customer segments, and improving the rate of the event demonstrably moves retention in response. An event that fails any of those three is measuring compliance with a flow, not activation.
For multi-seat B2B products, you need an extra layer in the test. An activation event that lives entirely inside one user's behavior and never propagates to the rest of the buying unit is a weak anchor, because the account can still churn even while that one champion is fully engaged.
Finding the activation event in your own data
The activation event isn't something a team designs from first principles at a whiteboard. You read it out of historical retention data, by comparing what accounts that stuck around actually did against what accounts that churned never got around to.
The method has a repeatable shape. Start by pulling the 90-day retention cohort. Then compare the retained users against the churned ones. Identify the first behavioral event in the data that cleanly separates those two populations. For each candidate action under consideration, calculate the retention rate of users who performed it inside a fixed window against the retention rate of users who didn't, and the candidate with the widest and most consistent gap across segments becomes the anchor event. Conceptually this is a join: product usage events linked to account records, filtered down to a defined time window, with retention rates computed on either side of the split. None of it requires new instrumentation. You just have to look at data that's usually already sitting in an events table or a product analytics warehouse.
Linear's own activation event, found through exactly this kind of analysis, turned out to be 5 issues created across 2 distinct days. The surface-level aha moment looks like creating a first real issue with a status, an assignee, and an estimate attached to it, but the event that actually predicts retention requires repeated use across more than one session. Linear tracks this internally with a quiet checklist that disappears the day after a user crosses the threshold.
Slack's version is the most cited example in the industry for a reason. Teams that cross that threshold retain at dramatically higher rates than teams that don't, and the vast majority of teams that exchanged that many messages were still using Slack later. That number is a behavior threshold, not a feature event, and it was found the same way Linear's was: by running cohort analysis against historical usage data rather than guessing at what felt like a meaningful moment.
Event selection isn't enough, because if you measure a correctly chosen event sloppily, you still get noise. Activation should be measured as a cohort rate: activated eligible accounts divided by eligible new accounts. Every cohort needs to be allowed to mature before it gets compared to anything else: a seven-day activation metric calculated for users who signed up yesterday is incomplete by definition. The same logic applies to feature adoption rates, which are far more actionable when measured against eligible users on the correct plan and in the correct role, rather than against the total user base, since measuring against ineligible users deflates the metric and produces a misleading picture of what's actually happening.
How activation rates vary by vertical
A single industry average hides more than it reveals, because activation rates differ so sharply by vertical that comparing a product against the overall mean can make a well-run team look mediocre or a struggling one look fine. Across 62 B2B SaaS companies, the average activation rate comes out to 37.5%, but the distribution under that average tells you more than the average itself.
CRM and sales tools tend to activate at moderate rates, with import friction standing out as the main blocker. FinTech and insurance products fall even lower, where verification steps and trust gates are often less a go-to-market problem than a sign the activation event itself hasn't been defined correctly yet.
The practical consequence of this spread is that a low activation rate in HR or FinTech doesn't automatically mean the onboarding flow is broken. It may just mean the product carries a lot of inherent setup complexity before a user can reach first value. The intervention that follows differs accordingly: assisted onboarding and pre-configured environments make sense for a product where real setup work is unavoidable, while a product where users can self-serve to value in minutes calls for a different kind of fix entirely.
This distribution isn't just an academic curiosity. It sets the dollar value of fixing activation. Compressing time-to-value is a revenue decision, not a product nicety, because onboarding-to-adoption has become the engine driving net revenue retention at a growing share of SaaS companies. A team that treats activation as a vanity metric is leaving an increasingly large piece of the revenue mix unaddressed.
Building the cohort matrix from the activation clock
Moving the clock start from signup to a validated activation event changes what every cell in a cohort matrix represents. A signup-anchored matrix groups accounts by when they filled out a form. An activation-anchored matrix groups accounts by when they first reached genuine value, not by when they signed up, and that changes what the matrix measures.
Structurally, each row now represents a cohort of accounts that reached first value in the same calendar period, rather than accounts that happened to sign up together. Accounts that signed up but never activated drop out of the matrix because their fate belongs to a separate upstream analysis: an activation funnel problem, tracked on its own terms rather than folded into a retention curve.
Picture the same underlying data run two ways. Anchored at activation, that same population splits: the never-activated accounts disappear into a separate funnel metric, and the matrix that remains tracks only accounts that got real value, producing a curve that starts higher and decays for reasons tied to the product experience after activation rather than to whether people ever engaged.
A complete picture comes from three matrices built this way, not one. Logo retention tracks what share of activated accounts are still active at each point in their tenure. Revenue or NRR tracks the dollar value retained and expanded from each cohort. A cohort can show strong logo retention and strong NRR simultaneously, so tracking only one metric hides whether a team has a retention problem, an expansion engine, or both. CAC payback by cohort ties the retention signal directly to unit economics, so you can see whether newer cohorts pay back acquisition costs faster or slower than older ones.
Reading the resulting matrix correctly means reading it column by column rather than row by row, because a single column holds the same tenure point across every cohort and gives the clearest read on whether the product is actually improving over time. If a column gets worse, something in the recent experience is broken, even if the headline retention number for the whole company still looks stable.
Behavioral cohorts add a second lens on top of this. This isolates onboarding and feature-adoption effects that acquisition cohorts can't separate on their own. Acquisition cohorts answer whether customers who joined in March retained better than customers who joined in October. Behavioral cohorts answer a different question: whether customers who did a specific thing early on retained better than customers who didn't, regardless of when either group joined.
Acting on either of these matrices depends on knowing more than just what happened inside the product. It also depends on knowing the current state of each account: which plan it's on, how many seats are active, whether configuration is actually in place. When you combine that account state with behavior over time, you can move from identifying an activation event to doing something with it, whether that's a targeted onboarding change, a feature prioritization call, or direct outreach tied to the specific behaviors known to predict renewal. Userlens is built around that combination of database state and product usage, which is one reason the activation-anchored matrix is the right foundation to build on rather than an optional refinement.
What the retention curve shape reveals
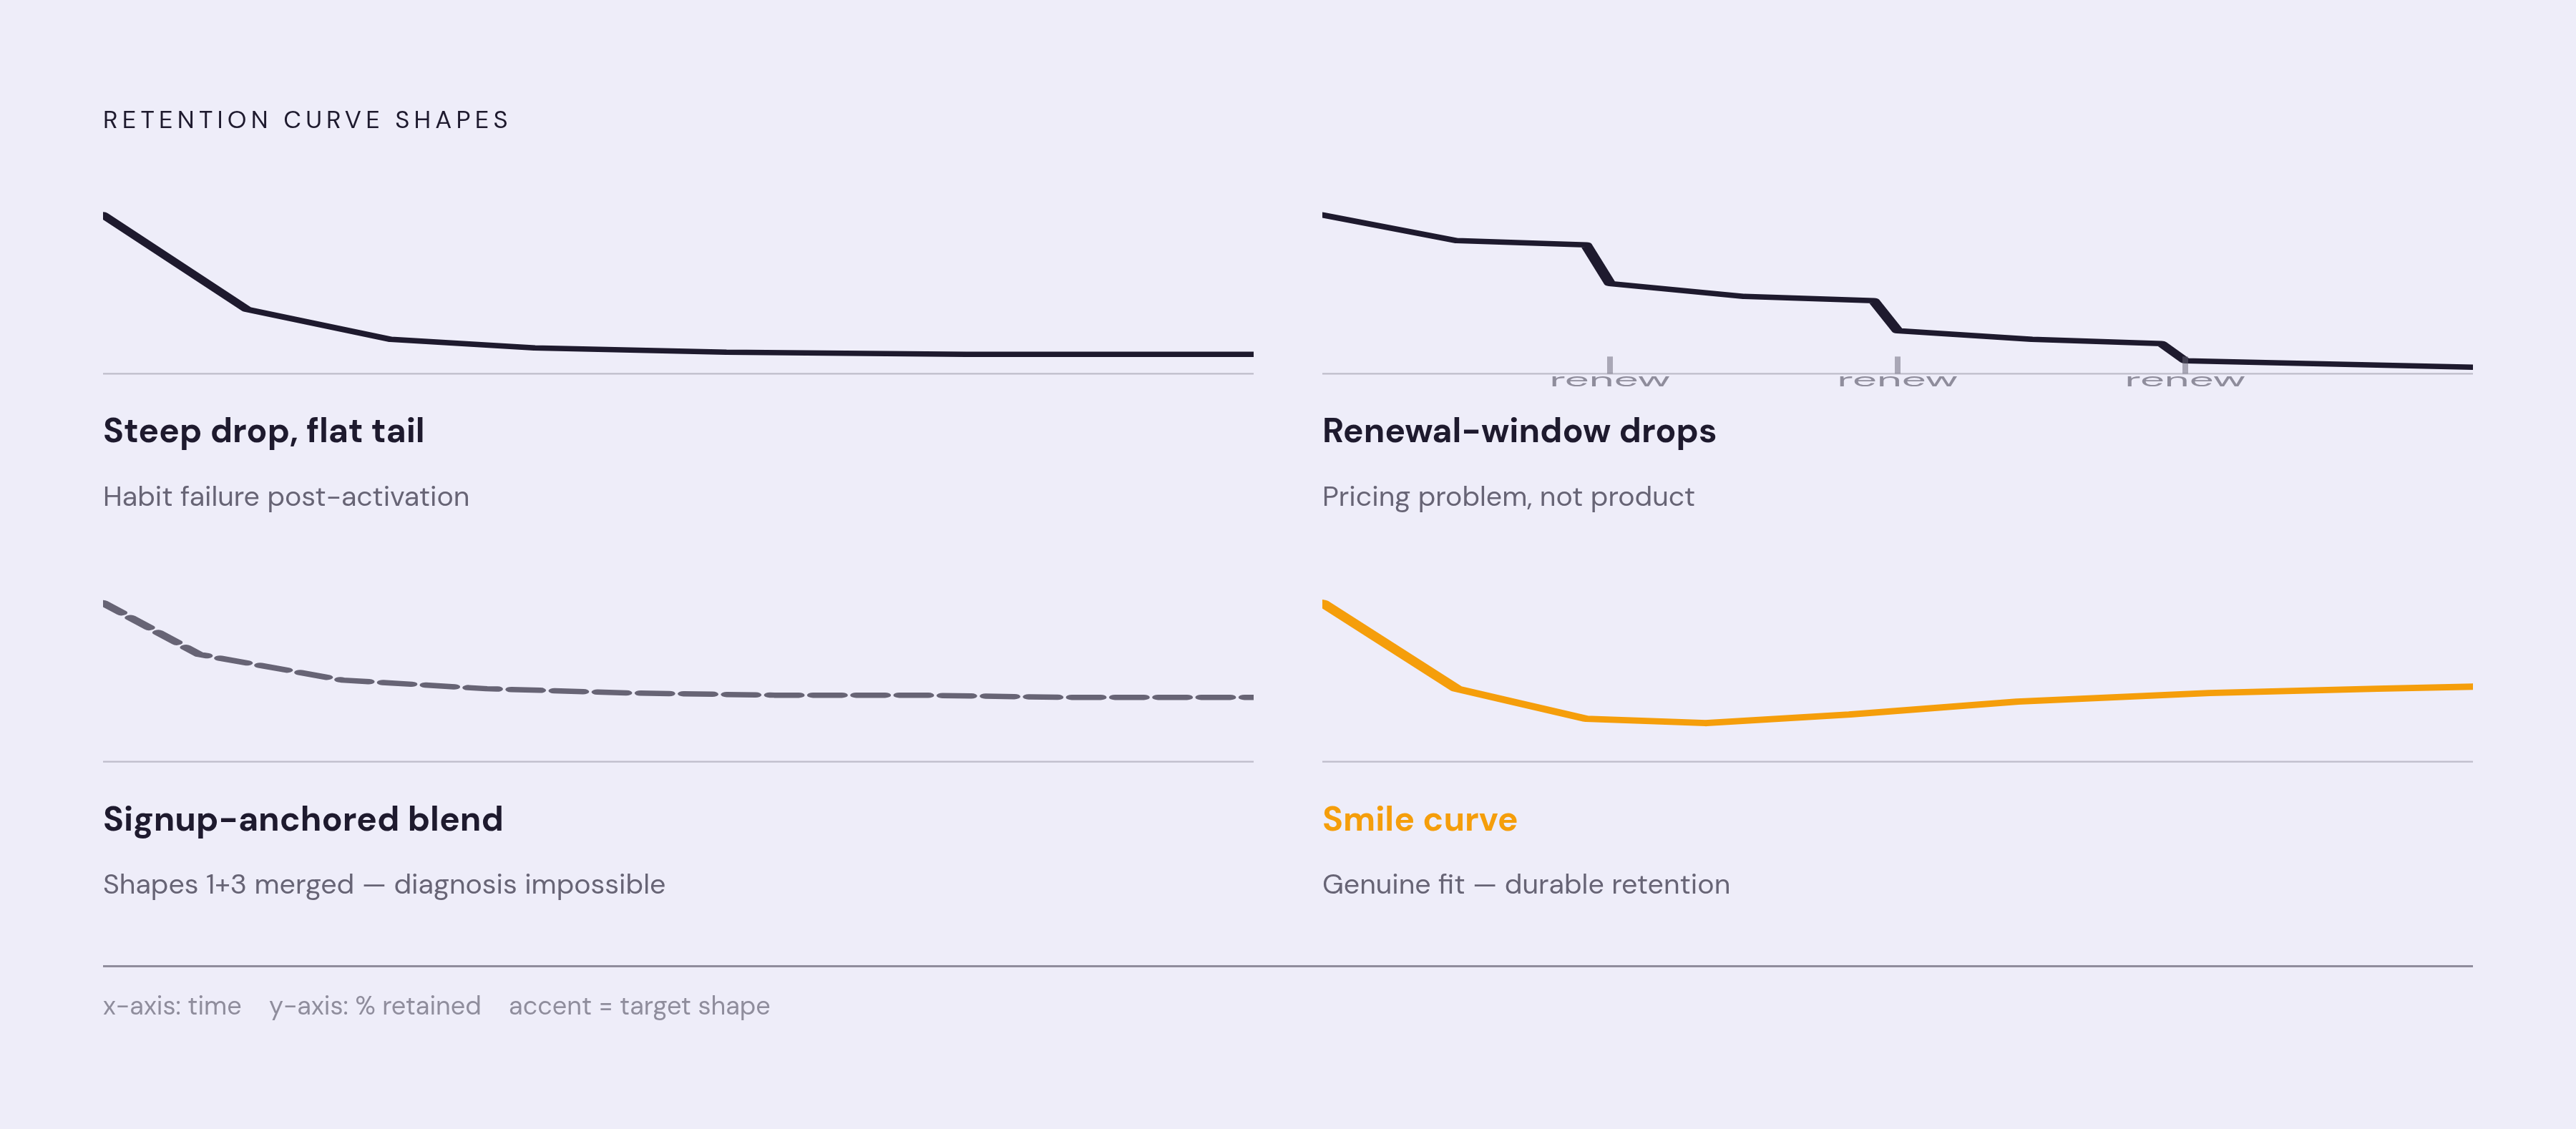
With the cohort clock anchored at a validated activation event, the shape of the retention curve functions as a diagnosis rather than a cosmetic detail. Different shapes point to different, specific organizational problems, and an FP&A-oriented framework lays out four of them.
A steep early drop followed by a flat tail signals activation failure in the deeper sense: these are accounts that made it through the activation gate but never formed a lasting habit around the product. The fix here lives in the weeks immediately after activation, not in the definition of the activation event itself, because the event was crossed correctly but nothing after that point reinforced the behavior.
If a drop concentrates late in the period, clustered around contract renewal windows, it points to a pricing problem rather than a product one. No amount of onboarding improvement fixes this kind of curve, because the people on it were never confused about the product. They were unconvinced about the price.
A healthy curve looks like this: a steep early drop that levels off into a stable tail, often called a smile shape. What matters is that the survivors beyond that point are durable, holding steady rather than continuing to bleed out over time.
Accounts in this curve activated genuinely and got real value, but they were never quite the right fit for the product to begin with, so they drift away at a roughly constant rate instead of churning in a sharp cluster tied to any single event like a renewal date. Reading this shape correctly depends entirely on having excluded the never-activated accounts first, because a signup-anchored curve mixes this slow ICP drift together with the sharp early drop of pure activation failure, and from the outside the two look identical. Once the clock starts at activation, each shape tells its own story, and the team looking at the matrix finally knows which problem it's actually solving.
Sources
- SaaS Cohort Analysis: The Operator's Guide to Retention
- SaaS Onboarding: 5-Stage Playbook for 2026 - Gatilab
- Time to Value: The 2026 SaaS Onboarding Metrics Framework
- Your Activation Rate Is Probably 37%. Here's What the 2026 ...
- SaaS Product Analytics: Events, Activation, and Retention
- SaaS Onboarding 2026: Beat the 37.5% Activation Trap (+ Free Checklist)
- SaaS cohort analysis: how to turn retention data into decisions