Identifying Power Users by Feature Depth Rather Than Session Length
Feature depth in your product predicts retention and expansion far better than session time.

Every growth team has the same dashboard open: daily active users, average session length, login frequency, charted against time. None of these numbers tell you whether a user got any value out of the product. A user can log in every single day, stay logged in for twenty minutes, and never once touch a feature that matters. Session length and DAU/MAU measure habit, not value, and habit is cheap to fake and easy to misread.
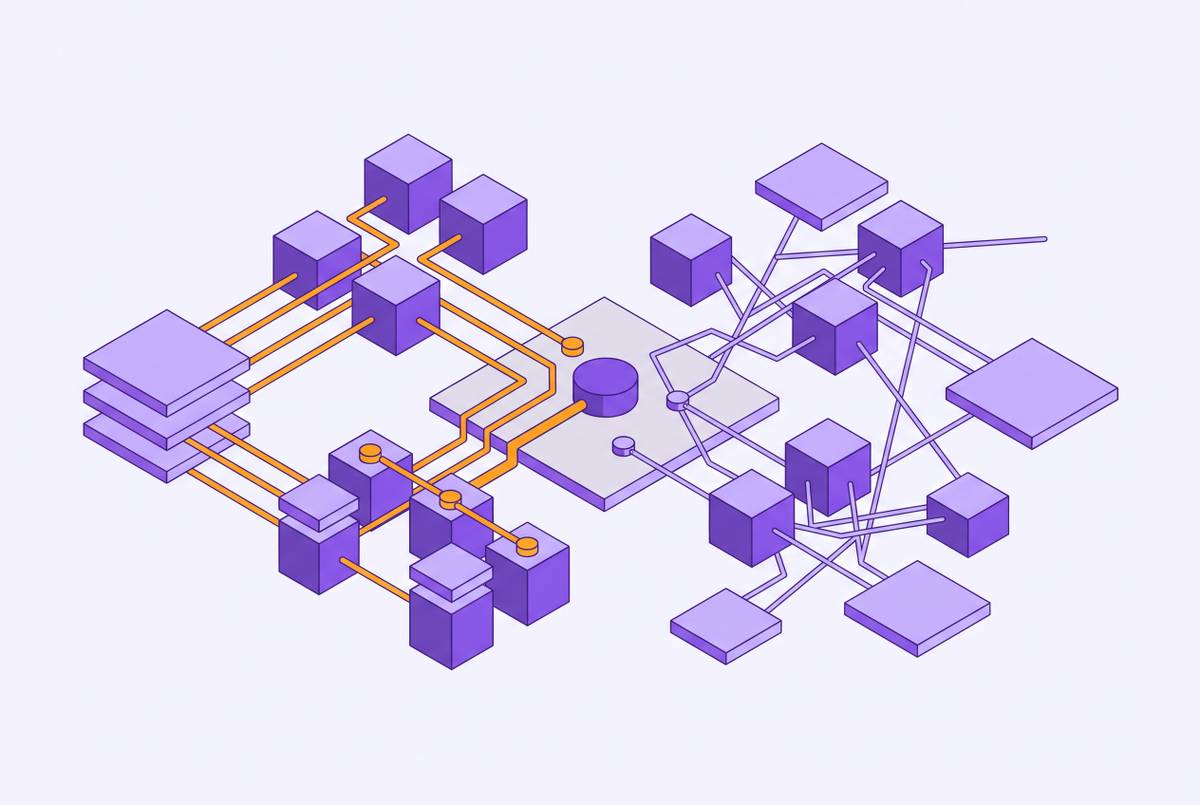
This failure happens because of how PLG products are built. Depth becomes visible in core workflows first, then integrations, then configuration, then advanced or admin-tier capabilities, as a user invests more effort. A user who logs in daily but never advances past the first layer is not on the same trajectory as a user who has gone looking for the second and third layers on their own. Treating both as equally engaged flattens a distinction that actually predicts what happens to the account next.
Shallow metrics do more than fail to help. They actively mislead, because they reward low-investment, habitual behavior and make a user who will never expand or advocate look identical, on a chart, to one who is about to become the account's champion. A team optimizing for session length ends up optimizing for the wrong population.
The strongest defense of session length is practical: it's easy to instrument, and every leader on the team already understands it. But that ease of measurement says nothing about whether the number predicts anything. The question that matters is whether a metric correlates with retention and expansion, not whether it fits cleanly into an existing dashboard. Session length fits the dashboard. It does not predict the outcomes the business actually depends on.
Why feature depth predicts expansion
Feature depth measures distance traveled into the product's value stack, and that distance works as a proxy for how irreversible a user's investment in the tool has become. A user sitting at the surface, using only the core workflow, can switch tools with minimal friction. A user who has connected integrations, configured permissions, and built workflows specific to their team has made a quiet but substantial commitment, whether or not they realize it.
The deeper a user goes, from core workflow through integrations through configuration into advanced or admin-tier features, the more the product gets woven into how they actually work. That entanglement makes replacement expensive. It is the same reason switching accounting systems is harder than switching to-do list apps: depth of use creates switching costs that session counts never capture.
Depth tracks closely with retention, and retention has become the number SaaS operators and investors care about most. Net revenue retention now drives valuation multiples in a way new-logo growth no longer does, so a business built on deep, entrenched usage carries more value per account than one built on high login counts and shallow adoption. Depth and retention move together because they share the same underlying cause: a user who has gone deep has more reasons to stay.
Depth predicts expansion for a related but distinct reason. Each feature a user adopts opens a new surface area for a higher-tier conversation. An account using five features has five separate reasons to need a bigger plan; an account using one feature has one. Expansion revenue follows from the number of doors a team has opened inside the product, not from how long they've been standing in the lobby.
Cursor's growth trajectory makes the mechanism concrete. The company's rapid ARR growth traces back to near-instant activation driven by feature depth: inline AI completions appear visible on the very first keypress, putting the product's core value in front of the user before any session-length accumulation could possibly explain the result. Depth made the value legible immediately, and immediate legibility is what time-on-site metrics can never measure.
The measurement problem: why most adoption figures use the wrong denominator
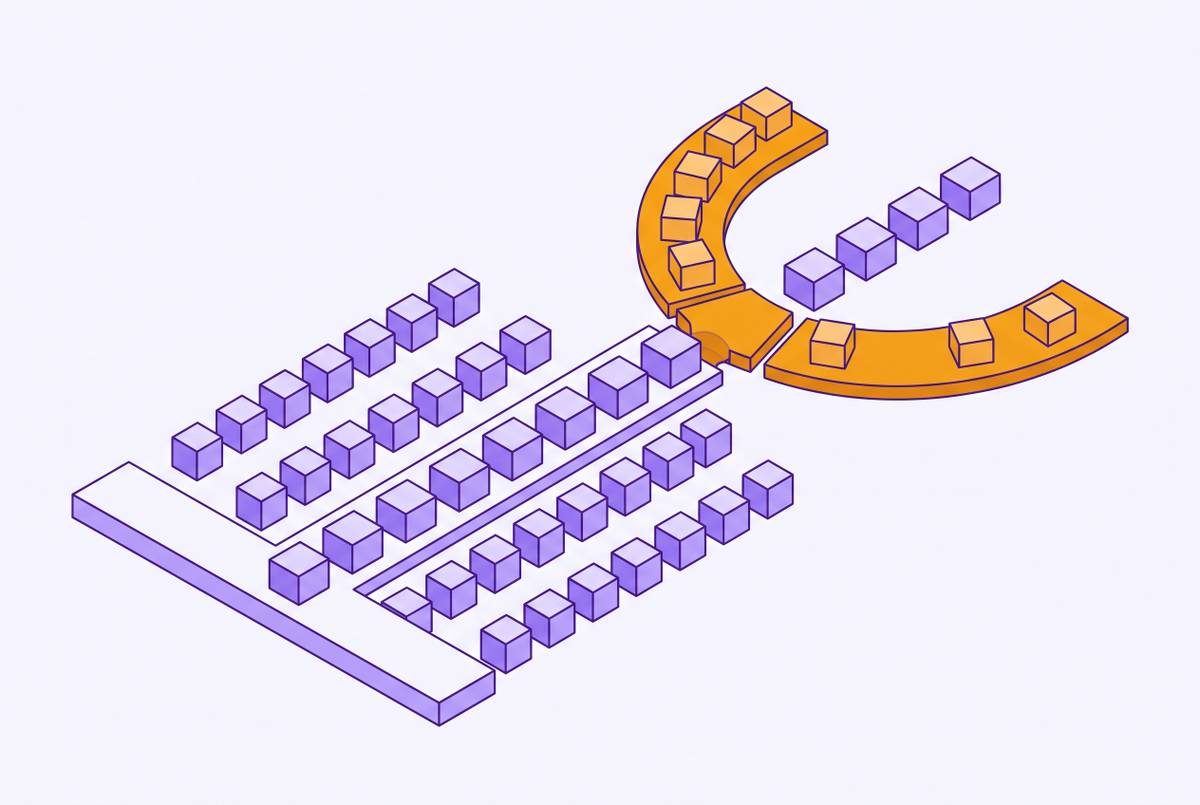
Most teams calculate feature adoption by dividing feature users by total users, and that denominator quietly erases the signal the team is trying to find. Averaging power users together with users who cannot access a feature at all, or who have no role-based reason to ever touch it, produces a number that looks precise and means almost nothing.
The fix is an eligibility-gated formula: feature monthly active users divided by total eligible user logins in the period, counting only users whose plan, role, or permissions actually expose that feature to them. This distinction matters with particular force in B2B SaaS, where admins and end users interact with the product in fundamentally different ways. An admin configuring permissions and an end user running daily reports are not comparable populations, and folding them into one adoption percentage produces a figure that is neither actionable for the product team nor comparable across customer cohorts.
Healthy 90-day adoption targets vary by feature type, and they mean something only when measured against the eligible cohort. Core workflow features should see 40 to 70 percent adoption among eligible users within that window. Power-user and advanced features will reach only a small minority of eligible users, by design, because they serve a narrower need. Admin and configuration features will reach a smaller fraction still, since only users holding the relevant role find those features relevant.
Instrument design has to track a second distinction alongside the fixed denominator: activation is first meaningful use, and adoption is sustained engagement. These are separate thresholds, and both need measurement that is kept apart from engagement-layer noise like opens and clicks, which tell you a user saw something, not that they used it. A power-user definition built on feature depth has to incorporate both thresholds for the same reason the denominator has to be fixed. A user who activated an advanced feature exactly once is a different signal from a user who has adopted it repeatedly, and a measurement system that conflates the two will misclassify both.
Feature-depth signals that separate power users from casual ones
Not every deep-feature interaction carries equal weight. The signals that most reliably separate power users from casual ones combine behavioral depth with evidence of investment that would be costly to walk away from.
Database state outcomes carry more information than event streams, because they record what a user actually built, not just what they clicked. The HubSpot workflow automation example illustrates the gap: users who created their first workflow within three days, and users who created two or more workflows in their first week, showed materially different retention and expansion trajectories than users who merely opened the workflow builder. The event of opening a tool says almost nothing. The state of having built something inside it says a great deal.
Enterprise-feature touchpoints work as quality signals even at low volume, because they don't need to repeat to matter. SSO setup attempts, admin permission configuration, API key generation, and audit log access all indicate enterprise-readiness independent of how often the account logs in or how many total sessions it has racked up. A single SSO configuration attempt tells a growth team more about account trajectory than a month of daily logins.
A composite scoring model gives these signals a structure. The product-qualified lead framework weights activation signals (completed core workflow, connected integration), depth and breadth signals (multiple features adopted, configuration depth), collaboration signals (teammates invited, shared workspace), and commercial-intent signals (pricing page viewed, plan limit reached), with depth and breadth weighted near the top, above both collaboration and commercial intent, putting the emphasis exactly where the earlier argument about irreversibility would predict.
Signal stacking at the account level turns an individual observation into an expansion signal. A single power user inside an account is a retention signal worth watching. Multiple users from the same domain crossing depth thresholds independently is an expansion signal, showing the tool spreading through a team beyond one champion's effort. The unit of analysis shifts from person to account when the goal becomes upsell.
Depth signals also have a limit: Canva's funnel data shows strong conversion from awareness to trial and from trial to activation, but a steep drop-off between activation and repeat use. A depth signal only holds value if the product can sustain it past first contact, and a team that stops watching after the first deep-feature touch will miss the moment the signal collapses.
A caveat belongs alongside all of this. Feature complexity can act as a filter on access. A user who never reaches advanced features might be blocked by onboarding friction rather than genuinely disengaged, and interpreting depth signals correctly means pairing the depth data with time-to-first-use and support-ticket context, not reading the absence of depth as automatic disinterest.
Building an Activation Definition That Captures Depth
An activation definition built only around reaching an "aha moment" captures first touch and stops there. A complete definition needs two parts: an entry event and a sustained-use threshold.
The entry event should be the first use of a feature a team has actual evidence predicts retention, not just any feature that happens to be prominent in onboarding. Finding that feature requires cohort analysis: comparing users who hit a candidate milestone against users who didn't, and checking which group retains better 90 days out. Only a milestone that survives that comparison earns a place in the activation definition.
The sustained-use threshold is what separates activation from adoption, and the research points to a specific boundary: using a feature three or more times within a 30-day window marks the line between one-time curiosity and a habit that's actually taken root. A single use proves a feature was discoverable. Three uses in a month proves it solved a recurring problem.
The same cohort method that identifies the entry event applies to validating the depth signal itself: compare activated users against non-activated users on downstream retention, then engineer onboarding to get users to that moment as fast as possible. The signal should be tested against real retention data, not assumed because it feels like the obvious milestone.
The leverage here is substantial. A modest improvement in activation rate typically produces roughly twice the improvement in paid conversion, which is the argument for investing real effort in a precise, depth-grounded activation definition instead of a loose, intuition-based one.
Building this in practice follows a short sequence. Identify the one or two actions that correlate with 90-day retention inside the team's own cohort data, rather than borrowing a milestone from a different product's playbook. Set two separate thresholds: an activation threshold for first meaningful use, and an adoption threshold for repeated use inside a defined short window. Gate the power-user label on the adoption threshold, not the activation one, since a single touch has already been shown to be a weaker signal than repeated use. Build the eligible-cohort denominator from the measurement section into this definition from day one.
Timing matters as much as the thresholds themselves. Best-in-class time-to-value runs under 15 minutes, and the same logic applies to depth: the path to a depth signal should be as short as onboarding allows, because depth reached in week one predicts retention more strongly than the same depth reached in month three.
Acting on depth signals: moving from identification to individualized intervention
Spotting a depth signal on a chart is a descriptive act. Acting on it for one specific person, at the moment they're closest to crossing the next depth threshold, is a prescriptive act, and the distance between those two is where most teams lose the value of everything they just measured.
The descriptive side of the business, the analytics dashboards and the lifecycle reports, hands a team a chart showing where users sit relative to depth thresholds. The prescriptive side has to hand the individual customer their next concrete step, grounded in what the product's own data shows about that person's current state. A chart that sits in a weekly review accomplishes nothing on its own.
A traditional automation rule fires a templated message once usage drops below a set threshold, regardless of why it dropped or what the account actually needs. A system grounded in actual behavior reads a given person's current product state and database context, decides whether the evidence really justifies reaching out, writes something specific to what that person needs next, and skips the message entirely when the evidence is weak. The skip logic matters as much as the send logic, because a message sent on thin evidence erodes trust faster than silence does.
A marketing automation case makes this concrete. When an account adopted webhooks, a specific power-user depth signal, the team offered an API access upsell tied directly to that behavior. When an account hit a plan-usage ceiling, the team proposed a higher tier at that exact moment. In both cases, the trigger was a specific, observed database state, not a generic engagement score averaged across the account.
The industry's track record on this kind of individualized execution is still uneven. Adoption of AI agents in customer-facing roles has grown sharply, but the depth of that deployment lags behind the headline adoption number. Only a small fraction of teams rate their own AI maturity as advanced, and only about a quarter have AI embedded end-to-end across onboarding workflows. The gap between using an agent at all and using one well is exactly where the competitive advantage sits for teams willing to close it.
Connecting depth signals to expansion and advocacy, not just retention
A power user identified through feature depth is not only a retention signal to protect. That same user is the most credible expansion vector available and one of the most reliable sources of product-led advocacy a team has access to.
Expansion runs through account-level signal stacking, the same mechanism described earlier: multiple users from one domain independently crossing depth thresholds is the product signal most likely to justify a higher-tier conversation. The marketing automation platform case shows what this looks like at scale. Expansion ARR grew from 20 percent of total new ARR to nearly half once depth signals, rather than raw account size, started driving the upsell trigger. Size tells a team how big an account is. Depth tells a team whether that account is ready to pay for more.
Advocacy runs through the same data from a different angle. Marketing teams are using long-term behavioral data to find power users whose activity suggests they're ready to influence others, then activating them through incentivized reviews, customer-led webinars, and expert Q&As. Feature depth is the behavioral evidence that tells a team whether a user is satisfied but passive or a willing advocate.
The outreach itself works better when it's specific. A message to a power user that references the exact feature workflow they've mastered, and invites them to share that workflow with peers, performs materially better than a broadcast NPS survey or a generic referral ask sent to the entire user base. Relevance is what makes that outreach land, and depth data is the only thing precise enough to make that relevance possible.