Stickiness Analysis for Collaborative Features in Multi-Seat Accounts
Standard stickiness metrics hide collaborative feature failures in multi-seat accounts.

Picture a product team pulling up its DAU/MAU dashboard and seeing a healthy, stable ratio. The collaborative feature they shipped two quarters ago, the one meant to get whole teams working inside the product together, sits almost entirely unused outside of one or two people per account. The ratio was built to answer a single question: does this user come back? It was never built to ask whether the group comes back, or whether the right roles are even present when it does. A single power user returning daily can inflate DAU with no collaboration happening at all, so the dashboard reads as healthy while the feature sits idle for the team it was built to serve. Compound that with a denominator problem: measure adoption against total users instead of the users who are actually eligible to use the feature, and genuine team-adoption failures disappear into the noise, masked by a population that was never going to use the feature. The two problems stack. A metric that looks fine at the account level can be hiding a feature nobody is collaborating around, and nothing about standard stickiness math will flag it.
The two separate things stickiness needs to measure in a multi-seat context
Fixing this starts with splitting one question into two. Measuring collaborative stickiness means tracking two things in parallel: whether individual users are forming a habit of return, and whether the account as a whole is generating the multi-person interactions the feature exists to produce. Picture these as two axes on a simple grid: individual return behavior running along one axis, group-level collaboration running along the other. A feature can score high or low on each independently, and the four resulting quadrants describe four very different product situations, not one blended health score. These two layers can diverge sharply. If strong individual stickiness pairs with weak group stickiness, it usually means one person has built a habit around the feature, but the collaborative workflow it was meant to create never formed. If strong group adoption pairs with weak individual return, it usually means the feature gets used in bursts, project kickoffs or quarterly reviews, rather than as a routine. Neither pattern is visible from a single blended ratio. Both require their own evidence, their own denominator, and their own fix.
How to define eligibility before measuring anything else
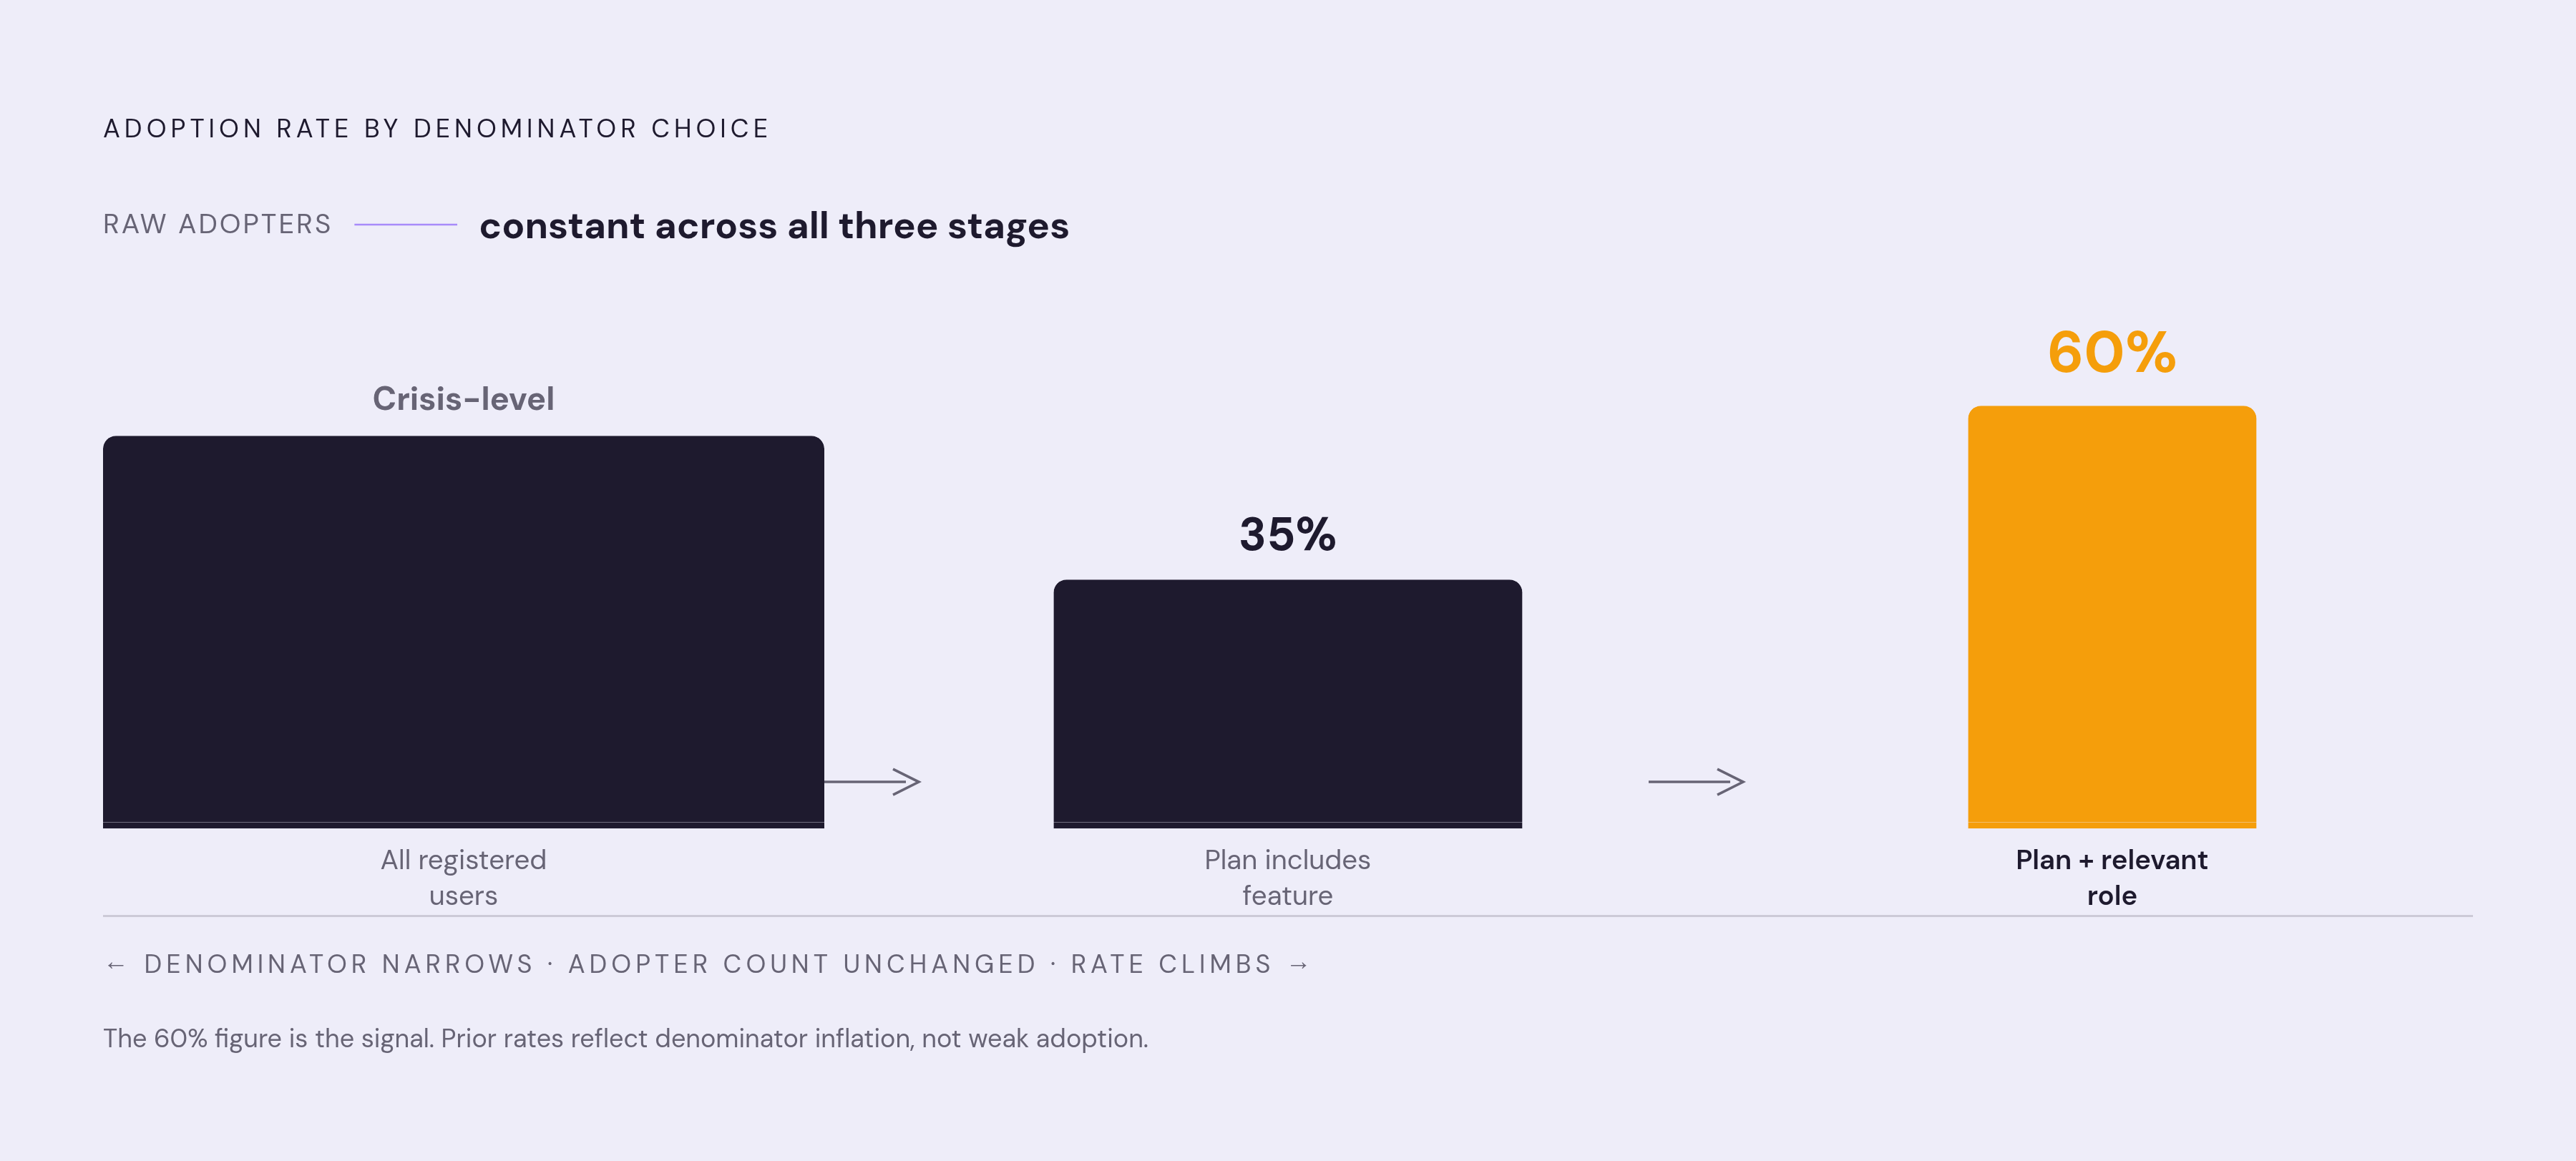
None of this works without getting the denominator right first. Every adoption number, every stickiness ratio, every group-threshold calculation is only as trustworthy as the population you measure it against. Get that population wrong, and a genuinely healthy feature can look broken, or a genuinely broken one can look fine. Eligibility has three parts: plan access, meaning whether the feature is even available on the account's tier; role relevance, meaning whether a person's role makes collaborative use of the feature meaningful in the first place; and minimum viable team size, meaning whether the account has enough seats for collaboration to be structurally possible. Take a single raw number, say some users have touched a collaborative feature at some company. Against total registered users, that number might look like a crisis. Measured against users whose plan includes the feature, it might be 35%. Measured against users whose plan includes the feature and whose role is relevant to it, it might be 60%, a number that tells a completely different story about whether the feature works. The raw count never changed. Only the denominator did. Core features, the ones carrying the primary value proposition, should clear a high adoption bar among eligible users. Secondary or advanced collaborative features can reasonably carry a lower bar, so if teams treat the two benchmarks as interchangeable, they end up declaring a struggling core feature healthy, or pouring resources into a secondary feature that's actually performing exactly as expected. Eligibility rules also need documentation and version tracking. The moment a feature rolls out to a new plan tier, or the minimum seat count for a team changes, the denominator shifts under every metric built on top of it, and without a tracked definition, historical comparisons quietly stop meaning anything.
The metrics that capture collaborative stickiness once eligibility is set
With eligibility defined correctly, three metrics working together give a complete view of collaborative stickiness: eligible-cohort adoption rate, team-threshold adoption rate, and repeat key-action rate. Build them in the order a practitioner actually would, starting with breadth. Eligible-cohort adoption rate divides activated eligible users by total eligible users, and it answers a simple question: did the right people ever even start using the feature? That's the breadth signal, the first checkpoint before anything deeper can be assessed. Next comes group depth. Team-threshold adoption rate divides accounts where a minimum number of distinct roles or users completed a collaborative action by the number of eligible accounts. This is the number that tells you whether a real group dynamic formed around the feature, rather than one person clicking around alone. Figma data shows roughly 70% of new Organization and Enterprise customers had at least one user who had previously been a Professional subscriber. A single individual's use became the seed for a group adoption event, and that group adoption event became the signal that predicted expansion. That's the kind of insight a blended, individual-only metric would never surface. Last comes individual habit. Repeat key-action rate tracks the share of eligible users who completed a defined collaborative action more than once in a given window, confirming whether the first use turned into a routine or stayed a one-time experiment. The DAU/MAU ratio still has a place here, but only when computed for the eligible, activated cohort, and only when read next to the team-threshold rate rather than on its own. Watch for one diagnostic pattern above all others: adoption rising while stickiness stays flat. More eligible users are activating, but they aren't coming back, which typically points to an onboarding flow that delivers a first moment of value without ever making the second use obvious. Breadth, depth, and repeat key-action rate form a single stack, so all three need to move together if collaborative stickiness is going to mean anything real.
Separating event types so the data tells the right story
None of these metrics can be computed without an event taxonomy built specifically to catch collaborative moments. The framework needs three tiers: entry events, value events, and habit events, each one designed around group behavior. Entry events, things like signup, first login, or onboarding started, mark the beginning of eligibility tracking at the individual level, but they say nothing yet about collaborative intent. Value events mark the first time the feature delivered its intended collaborative value, a comment left on a shared asset, a workflow handed to a second role, a document touched by a second contributor. These events are inherently multi-party by nature. The event that matters isn't "user A uploaded a file," it's "user B interacted with user A's upload," because the second actor's action is what confirms a collaborative moment actually happened. If instrumentation only fires on the initiating user's action, you can't calculate the team-threshold rate, and the whole stickiness signal collapses back down to individual behavior, exactly the problem this framework exists to fix. Habit events, return sessions, repeat collaborative actions, recurring multi-role interaction within a set window, confirm that a value event became routine rather than a one-off. None of these events mean much without database context sitting alongside them. A comment left by a user on a Professional plan is a different signal than the identical comment left on an Enterprise plan with a large seat count, so plan tier, seat count, and role assignments all need to be joinable to the event stream for any of this to be interpretable. Resist the urge to track everything. Pick one or two product events that actually predict retention in a given motion, because that beats comprehensive event coverage: a bloated taxonomy where every click gets logged creates a signal-to-noise problem, and that pushes teams back toward relying on last-login alone, which rarely tells enough of the story. None of this requires starting from zero. Many B2B SaaS products already have partial event instrumentation in place, though most teams are working with broken or missing events somewhere in the pipeline, and the real work is mapping what already exists to the three tiers and filling the gaps, not building an entirely new tracking plan from scratch.
Reading account-level patterns: the four adoption states a multi-seat account can be in
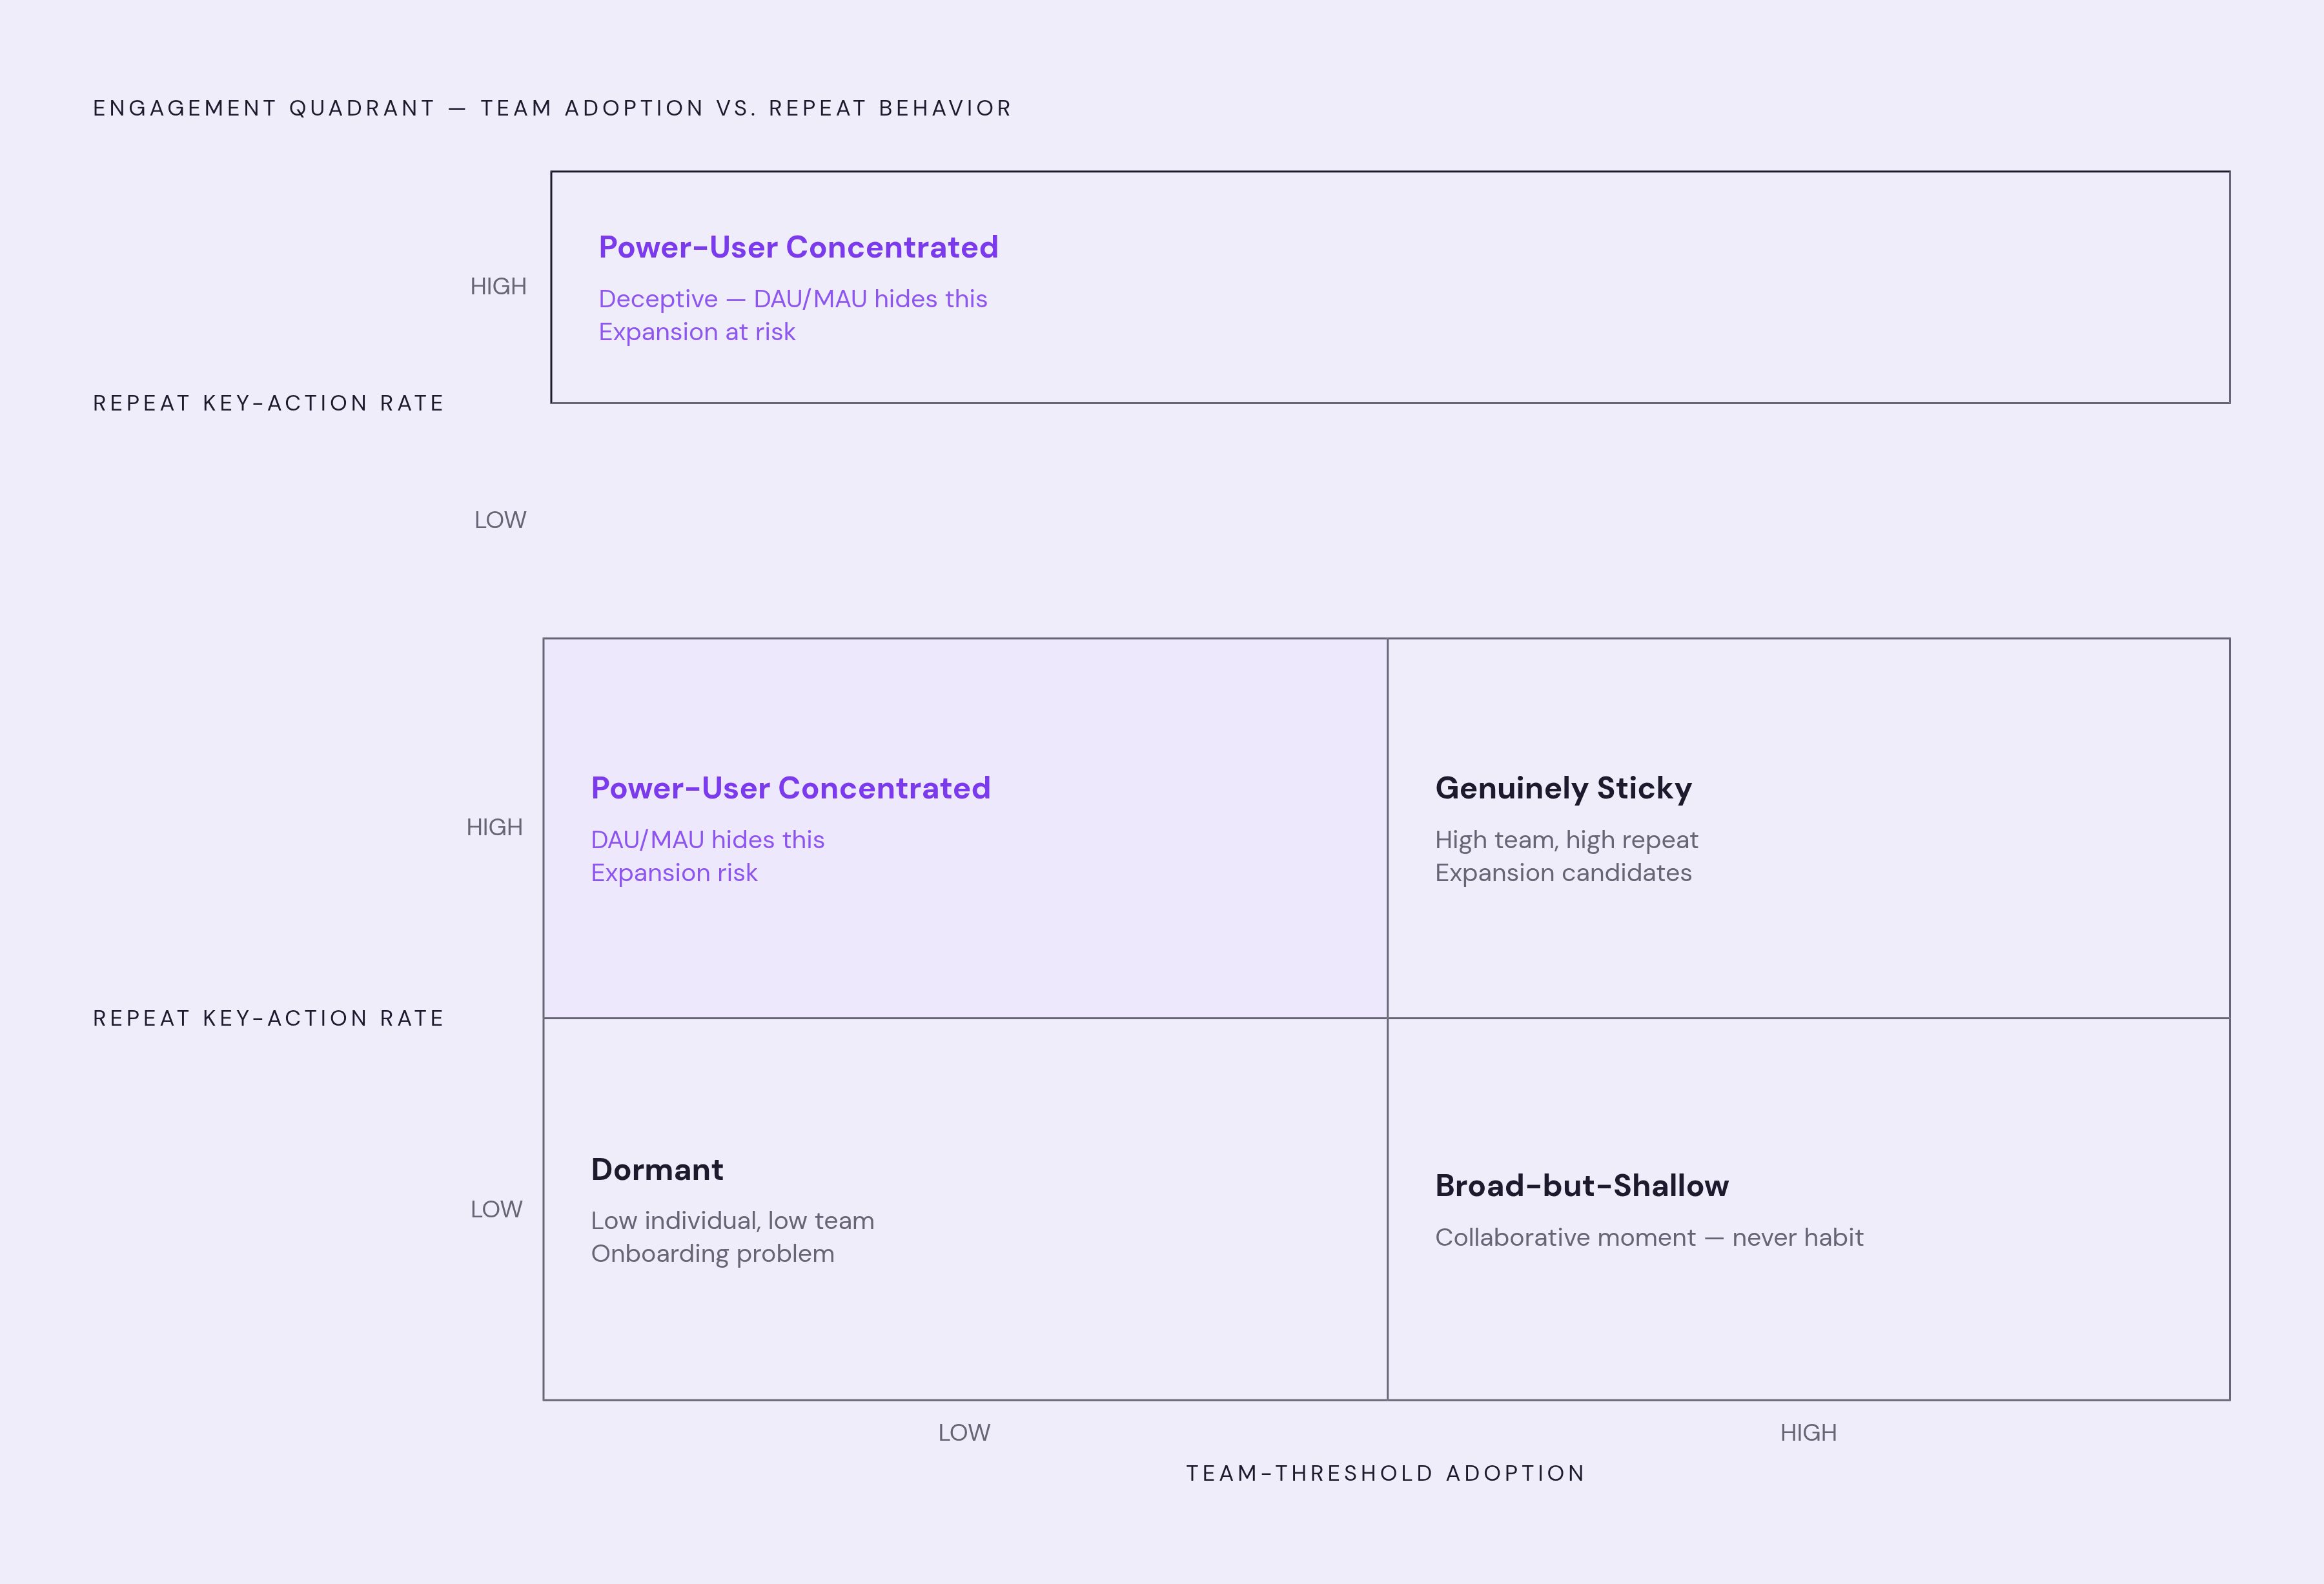
In the bottom-left corner sits the dormant account: low individual activation, low team-threshold adoption. The feature hasn't reached anyone in any meaningful way yet, and the likely culprit is discoverability or onboarding rather than anything wrong with the feature itself. The quadrant that deserves the most attention sits in the top-left: high individual stickiness for one or two users, paired with low team-threshold adoption. This is the power-user concentrated state, and it's the most deceptive one on the whole grid. The stickiness ratio looks completely healthy. One champion logs in daily, uses the feature constantly, and every blended metric reflects that enthusiasm. But the collaborative feature is effectively unused by anyone else on the account, which puts the account at real expansion risk rather than genuine adoption, no matter how good the dashboard looks. This is precisely the state standard DAU/MAU analysis is built to hide, because a single returning champion is more than enough to mask the fact that no actual collaborative workflow has ever formed. Moving along to the bottom-right, there's the broad-but-shallow account: plenty of users have activated, the team-threshold has been met, but the repeat key-action rate stays low. The collaborative moment happened, at least once, but it never turned into a habit, and the usual explanation is that the second use case was never made obvious after the first. Finally, in the top-right corner, sits the goal state: team-threshold met, repeat key-action rate high, a return habit formed across multiple roles. Accounts here, especially ones running high seat utilization, are expansion candidates, not accounts at risk, and they belong on a completely separate list from the dormant and power-user-concentrated accounts rather than lumped together on one generic risk report. A pre-post cohort comparison, adopters against eligible non-adopters across the same window, gives you a structured way to check whether moving accounts between these four states actually improves retention. That comparison shows correlation, and that's the right level of rigor for this kind of internal adoption analysis.
How behavioral triggers move accounts between states
Knowing which of the four states an account sits in only matters if that knowledge changes what happens next, and a calendar can't make that judgment. Calendar-based check-ins fire on a schedule regardless of whether an account is stuck, progressing, or already well past the point where any intervention would help, while the correct intervention logic ties the trigger to the adoption state itself. A "Week 1 onboarding call" fires on the same day for a dormant account and for an account that has already crossed the team-threshold and is returning daily on its own. In the second case, the call is irrelevant and wastes everyone's time. In the first, by the time week one rolls around, the account may have already formed a negative impression that a single scheduled call can't undo. Each of the four states calls for a different trigger logic. A dormant account should get a message triggered by absence, no value event within a defined window after eligibility was established, surfacing the collaborative feature and a clear first-use path. A power-user concentrated account needs a trigger based on the role gap itself: the champion has returned many times, but no second role has ever completed a value event, so the message should go to the missing role, not back to the champion who's already engaged. A broad-but-shallow account needs a trigger on drop-off, firing once the team-threshold has been met but the repeat key-action rate fails to form within a set period, surfacing the next obvious use case rather than repeating the first one. A genuinely sticky account running at capacity needs a completely different kind of message, one tied to an expansion signal, routing that account into an expansion queue instead of a risk queue. None of these triggers work as generic templates with a first name merged in. Each message has to be grounded in what the account's own data actually shows: where the collaborative workflow is incomplete, and what the specific next step looks like. Superhuman's early growth work offers a useful parallel here. Before any part of that onboarding was automated, people spent a full year running hundreds of interviews to figure out what "fast" actually meant to users, and only scaled the process once they'd crossed a clear activation benchmark. Software was asked to scale an answer humans had already found, not to discover the answer itself. The same sequencing applies to collaborative feature triggers: the behavioral logic that fires the message only works once the underlying state, dormant, power-user concentrated, broad-but-shallow, or genuinely sticky, has actually been figured out first. Frequency caps, quiet hours, and skip-if-unsure logic need to sit at the point of send. If the evidence for which state an account is in is weak or the signal is ambiguous, skipping the message is the right call, not sending one that risks being wrong.