Frequency and Recency Segmentation Beyond Login Counts
Login frequency masks whether customers actually use your product or are quietly leaving.
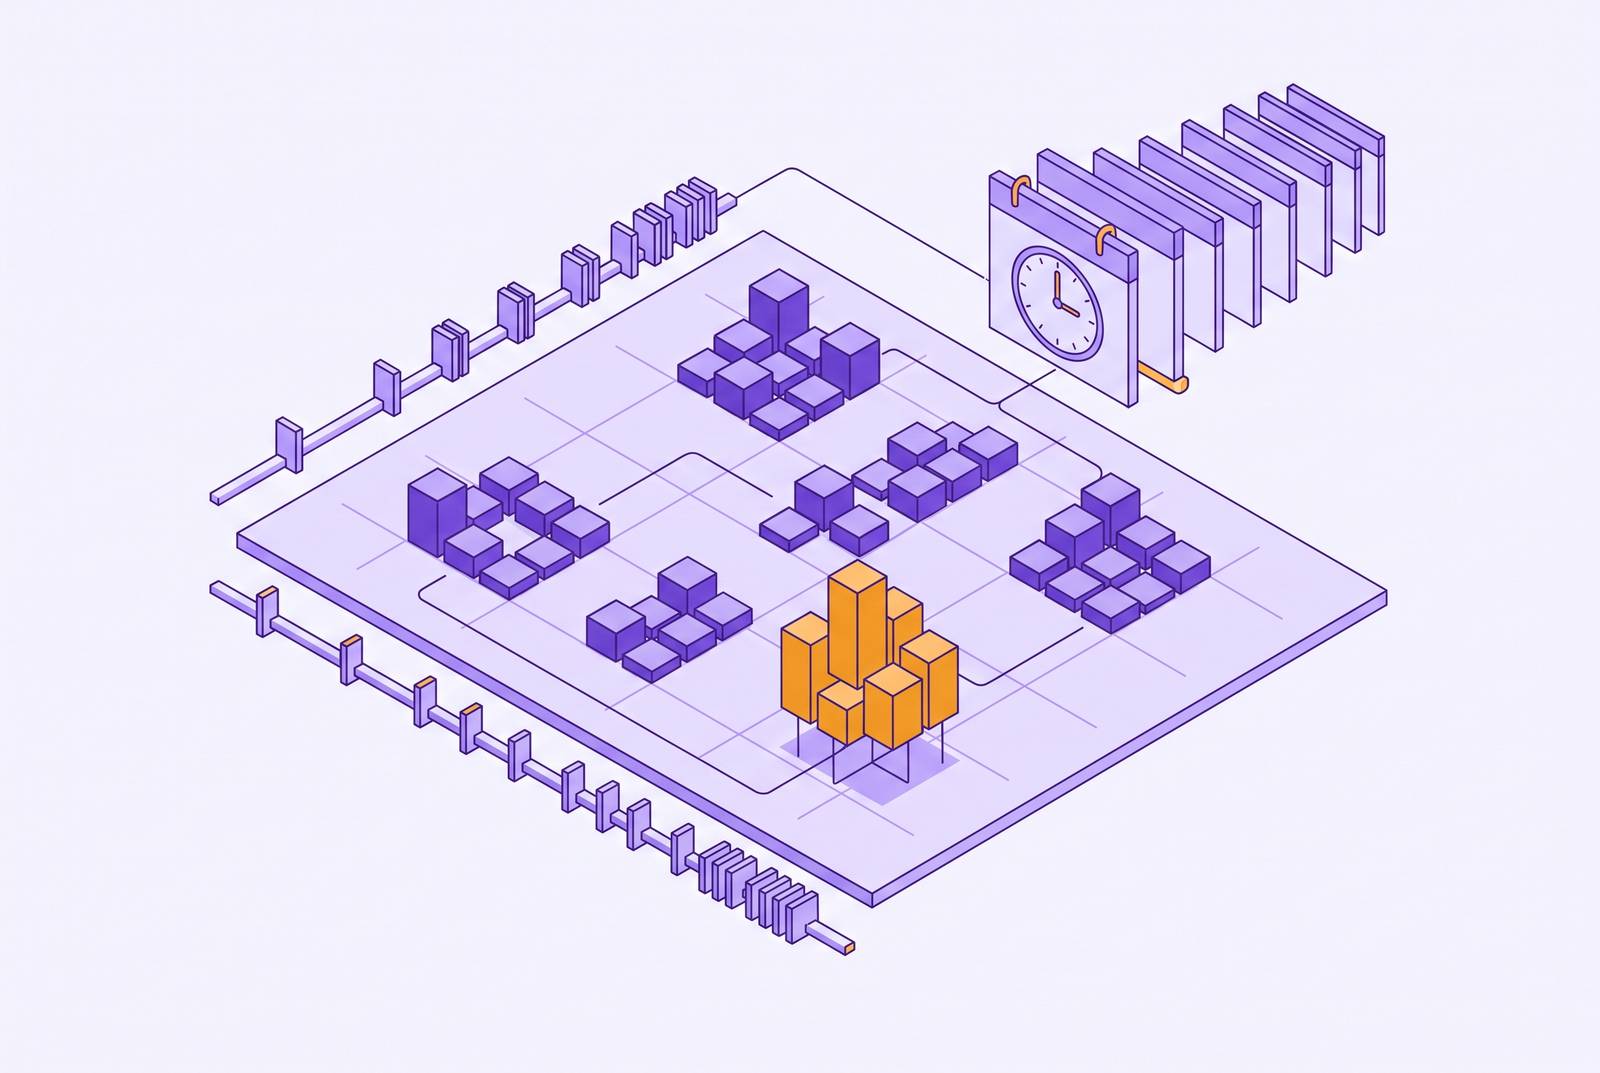
Picture the account that logs in every single day and touches nothing that matters. An admin opens the dashboard each morning out of habit, scans a screen, and leaves. Nobody on the team has added a seat in months. No core workflow gets finished. Under any segmentation model built on login counts, that account looks exactly like one that's thriving. That's the failure this piece is built around: login frequency measures whether someone showed up, not whether they got something done.
The mismatch creates two mirror-image mistakes, and both happen at once. On one side, accounts with high login counts but no workflow completion, no seat growth, and no real output look perfectly healthy on a dashboard while they quietly shop for a replacement product. On the other side, accounts that finished every onboarding step and folded the product into daily work can see their login count drop once the habit sets in, simply because people stop needing to think about a tool they now trust. A team watching login cadence alone reads the first group as safe and the second as fading, which is backwards in both cases.
The adapted B2B SaaS version of RFM segmentation treats recency measured by login as a lagging indicator. A drop in login frequency only shows up as a problem worth acting on after the account has usually drifted too far to save without a costly intervention. That lag matters most in multi-seat B2B products, where an admin might log in daily for reasons that have nothing to do with whether the people actually using the product are getting value from it. The login event tells a team about one person's habits. It says nothing about whether the other seats behind that login are producing anything.
None of this means login data is worthless. It means login data answers the wrong question. A segmentation model needs to answer whether value is being created inside the account, which calls for a different signal.
Defining "meaningful action" per feature
A meaningful action is the event that proves a feature did its job, not the event that proves someone found the feature. A segmentation model built on the shallow version will always overcount engagement.
Three categories cover most of what counts as meaningful in practice. Team engagement is the third: a support ticket that got resolved well, or a check-in between the customer and the vendor's team, both of which show the account is actively investing in the relationship rather than just paying the invoice.
The definition should build in trial versus adoption from day one. A feature trial is a single use driven by curiosity: someone clicks the new button because it's new. Feature adoption is repeated use folded into a regular workflow, driven by the user getting real value from it. The first time someone uses a feature says almost nothing on its own. It marks the start of the real question: whether that person comes back and uses it again without being prompted.
One more rule keeps this definition from drifting into noise: a meaningful action event needs a quality or completion signal attached to it. Five refreshes of a report don't add up to more value than one completed export. The event a team chooses to track should represent the outcome the feature was built to deliver, rather than the motion a user makes on the way there.
Reconstructing recency and frequency dimensions around meaningful actions
With meaningful action defined, recency and frequency can be rebuilt around it instead of around logins. Recency becomes the time elapsed since the last meaningful engagement, scored on a 1 to 5 scale where a score of 5 represents meaningful engagement within a short recent window and a score of 1 represents no meaningful engagement over an extended period. What changes is the event that starts the clock.
Frequency needs two dimensions measured at the same time, because one number alone hides too much. Multiply the two together and normalize the result to a 1 to 5 scale. The formula looks like this:
Combined frequency score = (Active Seats / Licensed Seats) × (Active Features / Total Features), normalized to a 1–5 scale
The reason to keep breadth and depth separate before combining them is that they describe different risks. A company using most of its seats but only one feature carries a different kind of exposure than a company using a handful of seats across many features. A single login count collapses both patterns into one undifferentiated number and hides the distinction a retention team actually needs.
A second formula fixes a related distortion in how adoption rates get calculated. Measuring feature adoption against the entire user base overstates how badly a feature is failing, because plenty of users in that base never had a reason to touch the feature. The fix is to narrow the denominator to the people who actually could have used it:
Feature Adoption Rate = Feature MAUs / Total Eligible User Logins in Period × 100
Here, "eligible" means people with access to the feature who stood to get some benefit from it, not every user in the account.
These two formulas feed into a larger measurement structure. A twelve-metric adoption dashboard, part of the broader 2026 framework for tracking product adoption, includes activation rate, time to value, P75 time to value, onboarding completion rate, key feature adoption rate, repeat key-action rate, feature depth, feature breadth, account activation rate, team or collaboration adoption, adoption by segment, and retained adoption. Recency and frequency, rebuilt the way described above, map directly onto pieces of that structure rather than sitting beside it as a separate system.
The B2B SaaS RFM model and its eleven actionable segments
Recency and frequency alone cover two of the three dimensions a working RFM model needs. The third, monetary value, has to be rebuilt too, because the classic version from retail and e-commerce assumes repeat purchases, and B2B SaaS runs on contracts and seats instead. Current monthly recurring revenue needs to be weighted against how much room an account has to grow, since a small account using a low percentage of its available capacity actually scores higher on expansion potential than a large account already running at full capacity. Expansion history over the past 12 months, meaning seats added and plans upgraded, feeds into the same score, and so does contract type, since a month-to-month account and an annual account carry different risk even at identical revenue.
Recency, frequency, and this reworked monetary score together sort a B2B SaaS customer base into eleven segments, each with its own R, F, and M profile and its own recommended play. Three of the eleven deserve particular attention, because they're the segments login-first segmentation hides most completely. Needs Activation looks similar from the outside, a paying account with low usage, but the cause is different: the account never built the habit in the first place rather than losing one it had, which calls for a completely different intervention than a reactivation campaign aimed at a lapsed user.
Each segment calls for one clear play rather than a blanket response. The other segments follow the same logic: the combination of recency, frequency, and monetary score determines not just how healthy an account looks, but which single action is worth taking next.
None of this holds still for long. Usage patterns in B2B SaaS shift within weeks, right after onboarding finishes, right after an account expands, right after a renewal scare passes, so segment membership needs a refresh every month rather than once a quarter. Feature adoption, seat activity, support ticket volume, and login recency are the signals to watch for decay between refreshes, in that order of weight.
Measuring the transition from trial to retained adoption
Most adoption dashboards watch the first two steps of the funnel closely and the third step barely at all, and that third step is where the real damage happens. A team measuring only the first two transitions will never see the third one fail, because by every number they're tracking, things look fine right up until renewal.
This is the handoff recency and frequency, rebuilt around meaningful action, are built to catch. First use of a feature only proves someone tried it once. The metric that actually separates durable adoption from a one-time experiment is the repeat key-action rate: did the user or account perform that same meaningful action again in the following week, month, or workflow cycle. It's been sampled.
Free users who never activate at all pay the highest business cost of missing this handoff. Tracking activation-to-repeat as its own measured step is what turns that silent churn into something a team can see coming and act on before the account goes quiet for good.
Combining current database state with behavioral history for segmentation signals
Behavioral signals, things like how often a feature gets used, whether workflows get finished, and how sessions unfold, predict churn and expansion more reliably than demographic or firmographic facts on their own. Demographic data describes who an account is. Behavioral data describes what that account is about to do next, which is the far more useful question for a retention or expansion team to answer.
The strongest signal comes from combining the two rather than picking one. Current database state, things like account tier, seat count, user roles, plan, configuration, and contract type, describes what the account looks like right now. Behavioral history describes whether that current state is holding steady or slipping. The space between those two pictures is where the real signal lives: an account that looks the same on paper this month as it did last month, but whose behavior has quietly thinned out, is a very different account from one whose paper profile and behavior are both stable.
Firmographic data adds a third layer without requiring new instrumentation. Five signals, company headcount, industry, tech stack, funding stage, and job function or seniority, can be pulled from a signup email domain in a single enrichment call, and these five drive most of the value firmographic data offers for personalization. Layered on top of behavioral data, they produce segments no single data source could produce alone: a user whose company matches the target industry and who has just completed a core workflow for the first time represents a qualitatively different opportunity than either fact would suggest on its own. The firmographic match says this account fits the kind of customer the product is built for. The behavioral trigger says this is the moment that account is most ready to hear from someone.
What makes this architecture practical rather than aspirational is that it doesn't ask for anything new. Nothing here requires new instrumentation. It requires combining data that already sits in separate systems and reading it together instead of apart.
Descriptive segmentation produces charts; prescriptive segmentation produces actions
Everything built up to this point, the meaningful-action definitions, the recency and frequency formulas, the eleven segments, the firmographic layer, produces a clear picture of account health. What a team does with that picture is a separate question that shapes whether all this measurement actually changes outcomes. The 2026 adoption tooling market splits along exactly this line: descriptive tools show which accounts sit in which segment; prescriptive tools take that segment membership and decide, then deliver, the next action for each account individually.
A descriptive tool, no matter how precise its segmentation math, still leaves a person staring at 300 accounts flagged At Risk with no way to act on all of them at once. The bottleneck is the number of hours a human has in a week to read dashboards and write outreach.
An adoption agent changes what happens after the segment gets assigned. It watches every account continuously instead of waiting for someone to open a dashboard, applies the same standard to account number 300 that it applies to account number 3, and brings in a human only when a situation genuinely calls for human judgment. That shift moves a team's time away from pulling reports and toward the conversations that actually move outcomes.
The Needs Activation segment illustrates the prescriptive/descriptive gap directly. A descriptive tool can show that an account is paying well but barely using the product. That's where its job ends. A prescriptive agent takes the next steps: it looks at what that account's users have and haven't done, weighs whether the evidence supports reaching out, and if it does, writes a message grounded in the specific gap between what that account has done and what a healthy account in its position looks like. The segmentation work covered in every section before this one only pays off once it reaches that last step, the one where a specific account gets a specific message because of a specific gap in its behavior.